Stock Market & World GDP Statistical Data Sculptures — Visualizing Economics
OTC Derivatives vs. World GDP Statistical Data Sculptures — Visualizing Economics: "The piece consists of two layers: the lower half is a mapping of the
world’s GDP and the top half is a mapping of the derivatives volume,
 alloted to the coordinates of the countries on a map."
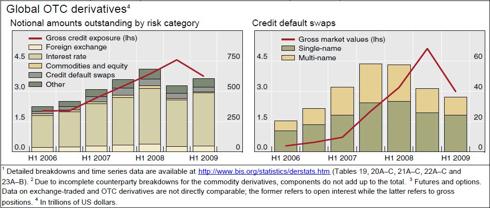
Norton's comment: So you can see the scale of OTC outstanding Derivatives in each country is MORE than the size of their annual GDP (gross domestic product)! This is still the case! Many of these derivatives are still listed and reported by the banks and the FED at face value when they could very well be worth 10 cents on the dollar.
So, when will these assets(or contingent liabilities) be revealed? What effect will they have on the stock market? On the bond market, on the financial statements? Don't you think that this is indeed a "...The Total Notional Value of OTC Derivatives Outstanding dropped from some $683 Trillion as of June, 2008 to $592 Trillion as of December, 2008, according to the Bank for International Settlements (BIS – the Central Banker’s Bank – see www.bis.org, Path: Statistics > Derivatives > Table 19) (Ed Note: A Rough “Cocktail Party” Definition of “Notional Value” is “Unrealized Potential Maximum Value.”)
This first drop in Notional Amount of OTC Derivatives Outstanding in years, mainly reflects the massive deleveraging which occurred during the Fall, 2008 Market Crash..." from http://tiny.cc/wdw80

world’s GDP and the top half is a mapping of the derivatives volume,

Norton's comment: So you can see the scale of OTC outstanding Derivatives in each country is MORE than the size of their annual GDP (gross domestic product)! This is still the case! Many of these derivatives are still listed and reported by the banks and the FED at face value when they could very well be worth 10 cents on the dollar.
So, when will these assets(or contingent liabilities) be revealed? What effect will they have on the stock market? On the bond market, on the financial statements? Don't you think that this is indeed a "...The Total Notional Value of OTC Derivatives Outstanding dropped from some $683 Trillion as of June, 2008 to $592 Trillion as of December, 2008, according to the Bank for International Settlements (BIS – the Central Banker’s Bank – see www.bis.org, Path: Statistics > Derivatives > Table 19) (Ed Note: A Rough “Cocktail Party” Definition of “Notional Value” is “Unrealized Potential Maximum Value.”)
This first drop in Notional Amount of OTC Derivatives Outstanding in years, mainly reflects the massive deleveraging which occurred during the Fall, 2008 Market Crash..." from http://tiny.cc/wdw80
from Seeking Alpha
Also see original article at http://tiny.cc/uyj6y Hera Research, LLC


Comments