Money Supply: first deflation then inflation
 Shows accumulation of M1, M2, and M3
 Long-term trend is increasing = inflation
Short term it decreased recently, then just turned up again as result of FED effort to inject liquidity into the banking system.
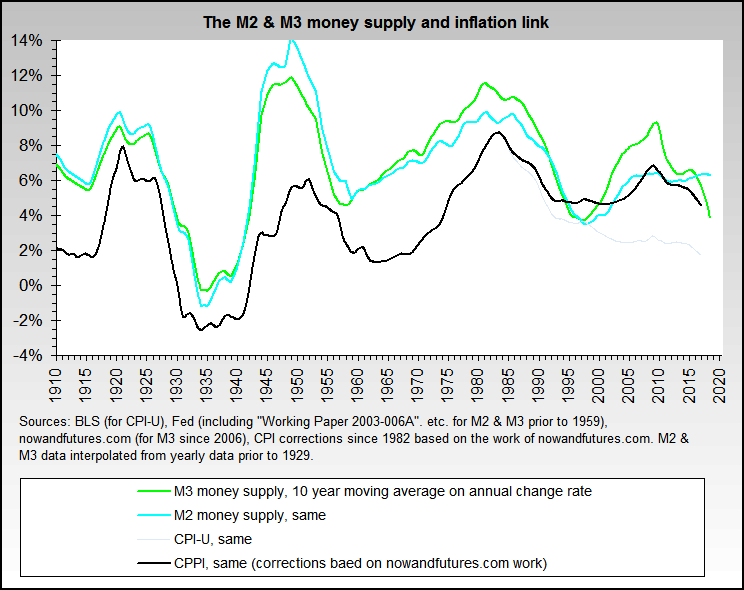
Here is our article on M3b, which details our work and notes the sources for the data. Note that as of Nov. 10, 2006 the Eurodollar estimation formula has changed - see the article for details.John Williams monthly reconstruction of M3 is here. Ours tends to be more volatile and averages slightly higher than his, partly because it's weekly and partly because of our minor differences in calculating the Eurodollar component of M3 and repos.Finally and to put M3 into proper perspective with inflation (as measured by CPI without lies), the M3 and M2 strong inflation link is virtually unquestionable. The longer term inflation picture is clear, although M2 shows a pause and likely temporary disinflation as of 2008. Certain bloggers are incorrect and have continually avoided these facts and the linked chart.


Comments